Model fact box (condensed)
Why is it relevant to communicate evidence to consumers?
The aim is for the consumer to be able to make (better) decisions. They need to know precise facts and figures - the so-called evidence - in order to weigh options against each other and better assess risks. In addition, the presentation of the exact case numbers helps the user not to underestimate or overestimate certain risks and to make informed decisions based on them.
Why is it problematic to communicate evidence to consumers?
If you want to communicate risks, you face a number of challenges:
- How can probabilities of occurrence be conveyed in general?
- How can very rare events be communicated in such a way that they are also recognised as rare?
- How can options for action be compared by considering potential harms and benefits?
- How can the difficulties that many people have with reading tables and comparing numbers be handled?
- How can reading from visualisations be simplified if complex information is supposed to be conveyed?
Consumer fact boxes. Evidence on the probabilities of occurrence of consequences of different decision options can be provided in a tabular format (Schwartz et al., 2009) with simple frequencies (if > 1%, then also as percentages).
Tabular fact boxes are evidence-based presentation formats (McDowell et al., 2016) that summarise the potential benefits and harms of options in a transparent and balanced way. The following figure shows an example from the field of health:
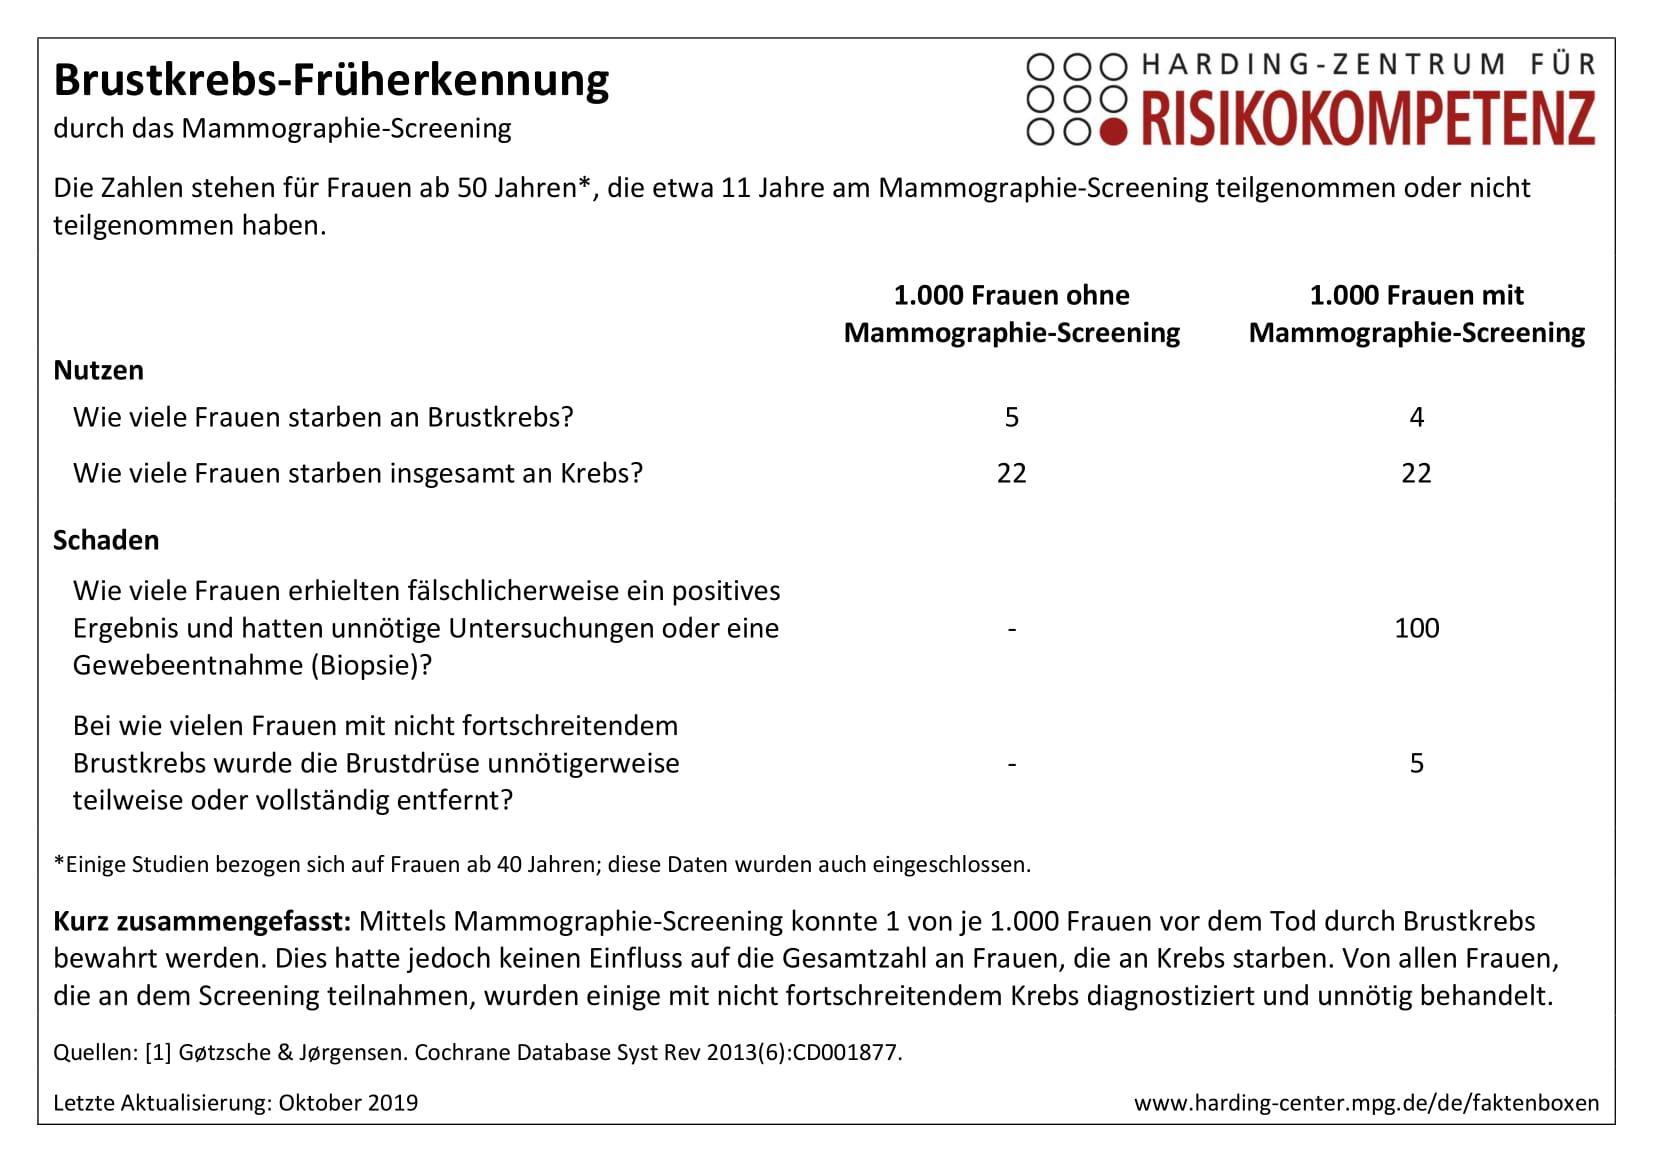
Fact boxes are transparent, balanced and understandable: in several randomised controlled trials they have proven to be an effective tool to increase the understanding of statistical data (McDowell et al., 2019) and to facilitate the extraction of information and the acquisition of knowledge after reading it once (Schwartz et al., 2009).
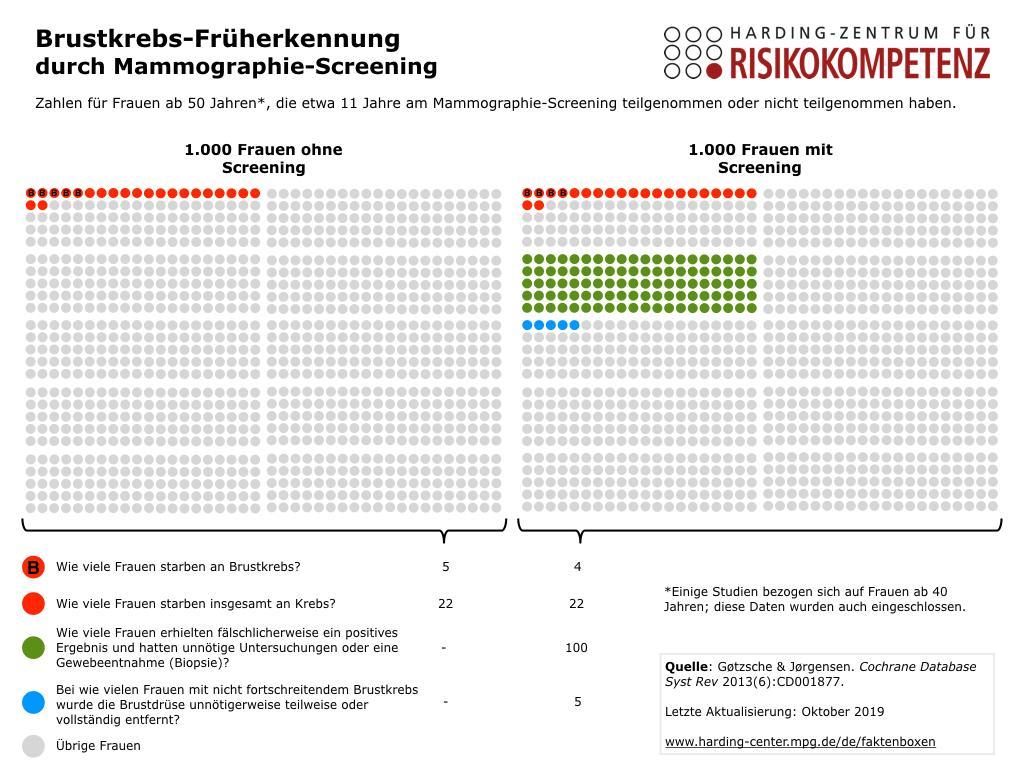
However, visualisations are essential to support consumers with low numeracy (Cokely et al., 2012). Specifically, empirically validated graphic formats (Garcia-Retamero & Galesic, 2010), icon arrays in particular, can be used in a fact box (McDowell et al., 2019). Here, icon array pairs compare the respective consequences resulting from the decision for an option with the help of coloured point proportions in a normalized group (e.g. 1,000 each). The following figure shows the icon array version of the tabular fact box above:
However, those standards were not available for the concrete implementation as a template for consumer organisations. Thus, a remedy was created within the RisikoAtlas project, and a standardised template for risk communicators was developed: the editable consumer fact box with icon arrays.
The presented model can be applied to a variety of risk decision problems. Whenever an organisation has collected data on options it wants to contrast, the model can be applied. It is important to note that a consumer fact box can never stand alone. It must always be integrated into a content framework that provides the context necessary for interpreting the box.
You can find the template live online:
https://static.risikoatlas.de/visualisations/fact-box-editor-compact/fact-box-editor.html?lang=en.
The boxes are filled directly in the browser and a PDF is generated accordingly, which can be saved and forwarded. Data files can also be exported or imported.
Important points for the design:
- The title of the topic of the decision problem should be described precisely.
- Explanation of the fact box: Here the reference group must be explained, i.e. to whom the decision problem refers. It is mandatory to describe the group that was used to obtain the data - not the group that you imagine to be the target group!
- On the summary of the evidence in the form of a single sentence on the relationship between potential benefits and harms: An assessment must not be included here, as the fact box is not designed to present interpretations. If necessary at all, interpretations or recommendations should be placed exclusively in the context of the consumer fact box, and should be identified as such and presented separately from the facts.
- Simple group labels need to be chosen which make the two decision options distinguishable.
- End points need to be chosen which identify the consequences, i.e. the potential benefits and harms of the decision options.
- The number entries are formulated in a simple frequency format (select either 100 or 1000).
- Sources on the numbers that are to be visualised must be included.
- The date of the last update must be included.
- Cokely, E. T., Galesic, M., Schulz, E., Ghazal, S., & Garcia-Retamero, R. (2012). Measuring Risk Literacy: The Berlin Numeracy Test. Judgment and Decision Making, 7(1), 25-47.
- Garcia-Retamero, R., & Galesic, M. (2010). Who proficts from visual aids: Overcoming challenges in people's understanding of risks. Social Science & Medicine, 70(7), 1019-1025.
- McDowell, M., Gigerenzer, G., Wegwarth, O., & Rebitschek, F. G. (2019). Effect of Tabular and Icon Fact Box Formats on Comprehension of Benefits and Harms of Prostate Cancer Screening: A Randomized Trial. Medical Decision Making, 39(1), 41-56.
- McDowell, M., Rebitschek, F. G., Gigerenzer, G., & Wegwarth, O. (2016). A simple tool for communicating the benefits and harms of health interventions: a guide for creating a fact box. MDM Policy & Practice, 1(1), 2381468316665365.
- Schwartz, L. M., Woloshin, S., & Welch, H. G. (2009). Using a drug facts box to communicate drug benefits and harms: two randomized trials. Annals of Internal Medicine, 150(8), 516-527.
What do I need this visualisation for?
If you want to find out whether a diet with more Omega-6 fatty acid has positive effects on your cardiovascular risks.
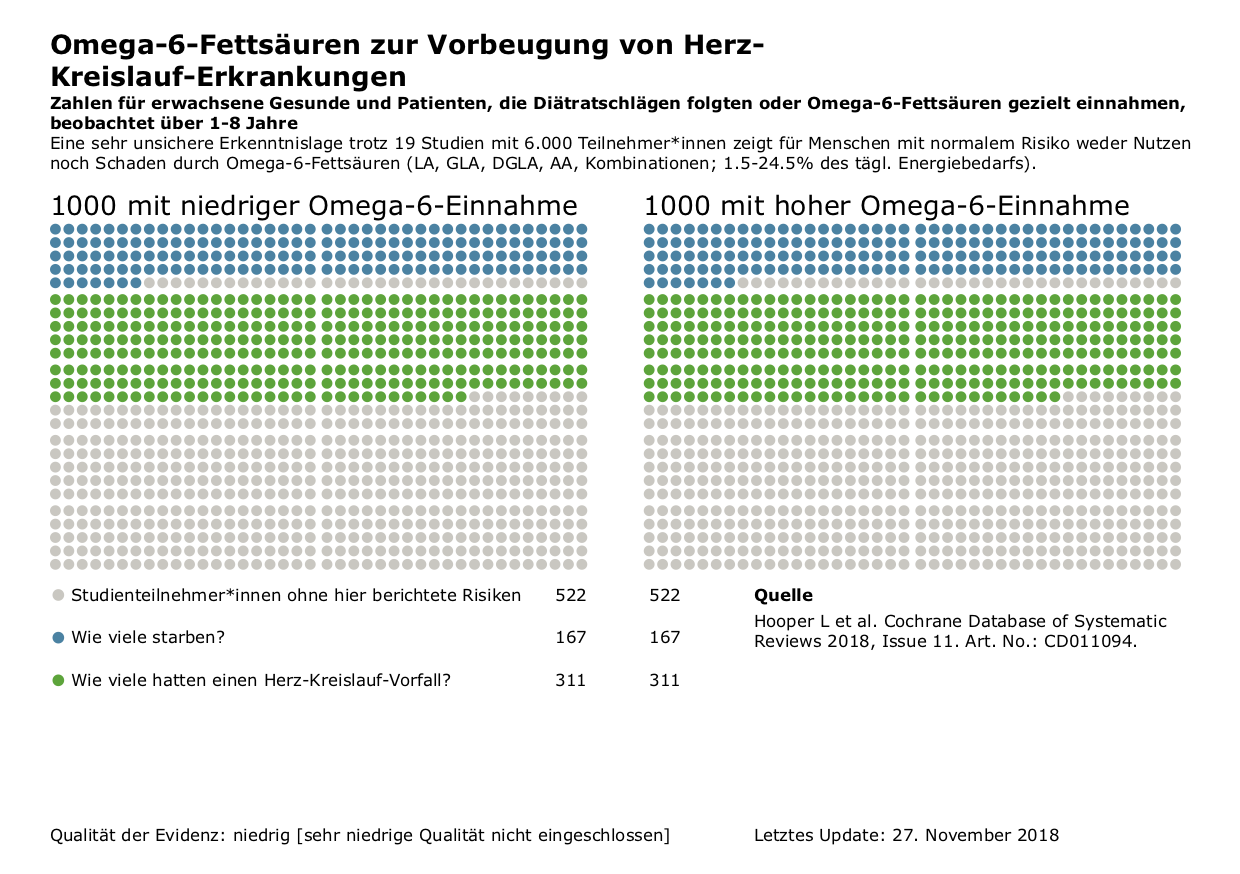
Data was ontained from a systematic review from the Cochrane Library (www.cochranelibrary.com).
However, this study states that despite 19 studies with almost 6,500 participants, the quality of the evidence is only low or very low. This means that future studies are very likely to change the results.
Empirical evaluation with consumers
All research results on the fundamentals and on the effectiveness of the RiskoAtlas tools in terms of competence enhancement, information search and risk communication will be published together with the project research report on 30 June 2020. If you are interested beforehand, please contact us directly (Felix Rebitschek, rebitschek@mpib-berlin.mpg.de).
Source:
Hooper, L., Al‐Khudairy, L., Abdelhamid, A. S., Rees, K., Brainard, J. S., Brown, T. J., ... & Song, F. (2018). Omega‐6 fats for the primary and secondary prevention of cardiovascular disease. Cochrane Database of Systematic Reviews, (7).